Time Doctor reports contain a lot of information. Since this might be overwhelming at first, let’s start with the basics and look at the common insights team managers can get from these reports.
The Types of Information Time Doctor Provides: A Basic Overview
- Total time worked: The total time tracked by Time Doctor’s desktop and mobile apps as well as manually added time. This doesn’t include breaks or other times when the apps were paused/stopped.
- Productive/unproductive/neutral websites and apps time: This is based on the websites and apps employees used and their productivity ratings. Productivity ratings can be adjusted at the company, team, and individual levels.
- Idle minutes and idle seconds: Time Doctor checks if there was any keyboard or mouse activity each minute or second. It then calculates the idle minute/second percentages and totals.
- Time spent on websites and apps: Time Doctor tracks how much time was spent on each website and app, including the option to see the time spent on individual web pages and the titles of open windows.
- Start & end times: This is recorded for each user for each workday.
- Time worked for each project and task: Time Doctor will record this if the project and task tracking is enabled.
- Screencasts (if enabled): Time Doctor will take screenshots or continuous video recordings of users’ screens. Each screenshot/video recording also shows the average keyboard and mouse activity levels in the time period that the screencasts/video recording was taken.
The Insights Team Managers Can Get Based on This Data
Users are spending time on non-work related activities
This means their share of total unproductive websites and apps time is higher than what you consider acceptable. This typically means that people are doing non-work-related activities while tracking time. However, it might also mean that your productivity ratings are incorrect. You can investigate what unproductive websites and apps each person has used in the side panel of the Web & App Usage report.
You can also take a look at the time spent on websites and apps that were rated as neutral. In general, these aren’t a problem. But if a user spends too much time on neutral sites, they might be spending too little time on websites and apps that are actually productive.
Users are using the correct websites and apps, but aren’t really working
Looking at the idle minutes and idle seconds in the Activity Summary report will give you a better understanding of whether people are actively working or just have productive apps open. You do need to be careful when judging whether what you see is a problem or not though. For some jobs, a high percentage of idle minutes is normal, such as for users who spend most of their time on calls or doing other activities that don’t require them to use their keyboard or mouse a lot.
The best insights come from comparing people doing the same type of work and looking at idle time percentages over an extended period of time. This will help you to avoid worrying about individual days when users just happened to do work that required less keyboard/mouse activity.
Clicking on each cell showing idle minutes and seconds will open a side panel with more details on where this idle time was spent: on which websites, apps, and tasks.
Users aren’t focused
They might change tasks too often, for example, without spending a reasonable amount of time on each of them continuously. They might also work for a short period of time, take a break, and work for another short period of time before taking another break. This kind of working pattern might lead to them being less focused on their work.
You can see each user’s working patterns in their individual user dashboard. Even if your users have flexible working hours, it’s often useful to know what their work trends are to see if there’s anything inefficient, such as a lack of continuous work on a task or late-night working hours.
Users who need to collaborate aren’t working at the same time
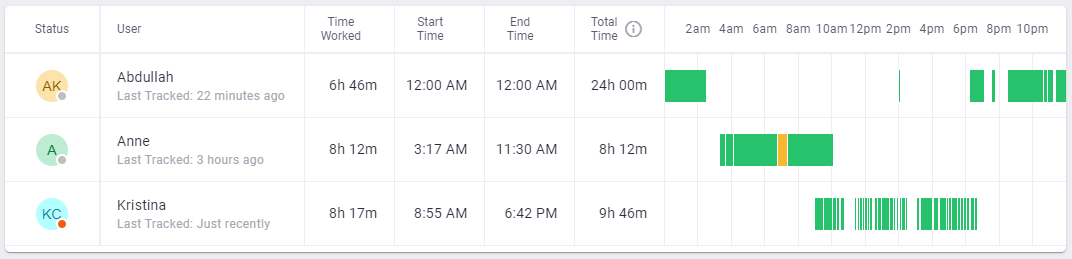
A lack of overlapping working hours might happen if your team has flexible working hours. This could lead to lower efficiency if people who need to collaborate have to wait for each other to start working. You can see how team members’ work hours overlap in the Timeline report.
Users have unevenly distributed work hours
Do users who have to work eight hours per day actually work eight hours per day? Or do they work less than that, then try to make up for the missing hours by working extended hours at the end of the week or month? You can check this in the Hours Tracked report.
Why are some days less productive?
It’s normal for some days to be more productive than others. If there’s an unexpected drop in productivity on certain days with no good explanation (such as training that requires using non-work-related websites), you might want to investigate and see what happened.
You can click one of these less productive days in the Web & App Usage report and see who contributed to the lower overall productivity. You can then investigate further by seeing what unproductive websites and apps they used.
What are the most common digital distractions?
You can filter and see the top unproductive websites and applications used by a particular team in the Web & App Usage report. If something doesn’t look right, you can click on that website/application and see who used it and for how long.
Which tasks take too much time?
If your team tracks time to projects and tasks, the Projects & Tasks report allows you to see the total time per task by selecting the Project-Task-Person view. This will show you if the total time spent by your team on some tasks is much more than what you think it should be.
Why do users have strange activities?
Is someone working late? Does any other activity not look right? For example, is someone spending too much time on a particular task? You can click on the corresponding block of time in the Timeline report to see what websites/applications they’re using and check their screencasts to investigate what’s going on.